geneTo join google classroom and check your exam results.
-
Go to classroom.google.com.
- At the top, click Add
Join class.
- Enter the class code and click Join.
Midterm exam – Date:
Exam locations:
- Sign in to Classroom at classroom.google.com.
- On the homepage, click Add Add and then Join class.
- Enter the code and click Join. Code :
Lecture Slides 1 Lecture 1 code Introduction to Sci Comp, variables, print function

Lecture Slides 2 Lecture 2_code Arrays, subarrays, arithmetics, built-in functions (mean,max, min, std, sum, cat etc), cell array, table array.
Data slicing, vector/array operations, matrix multiplication, data cleaning for missing values.
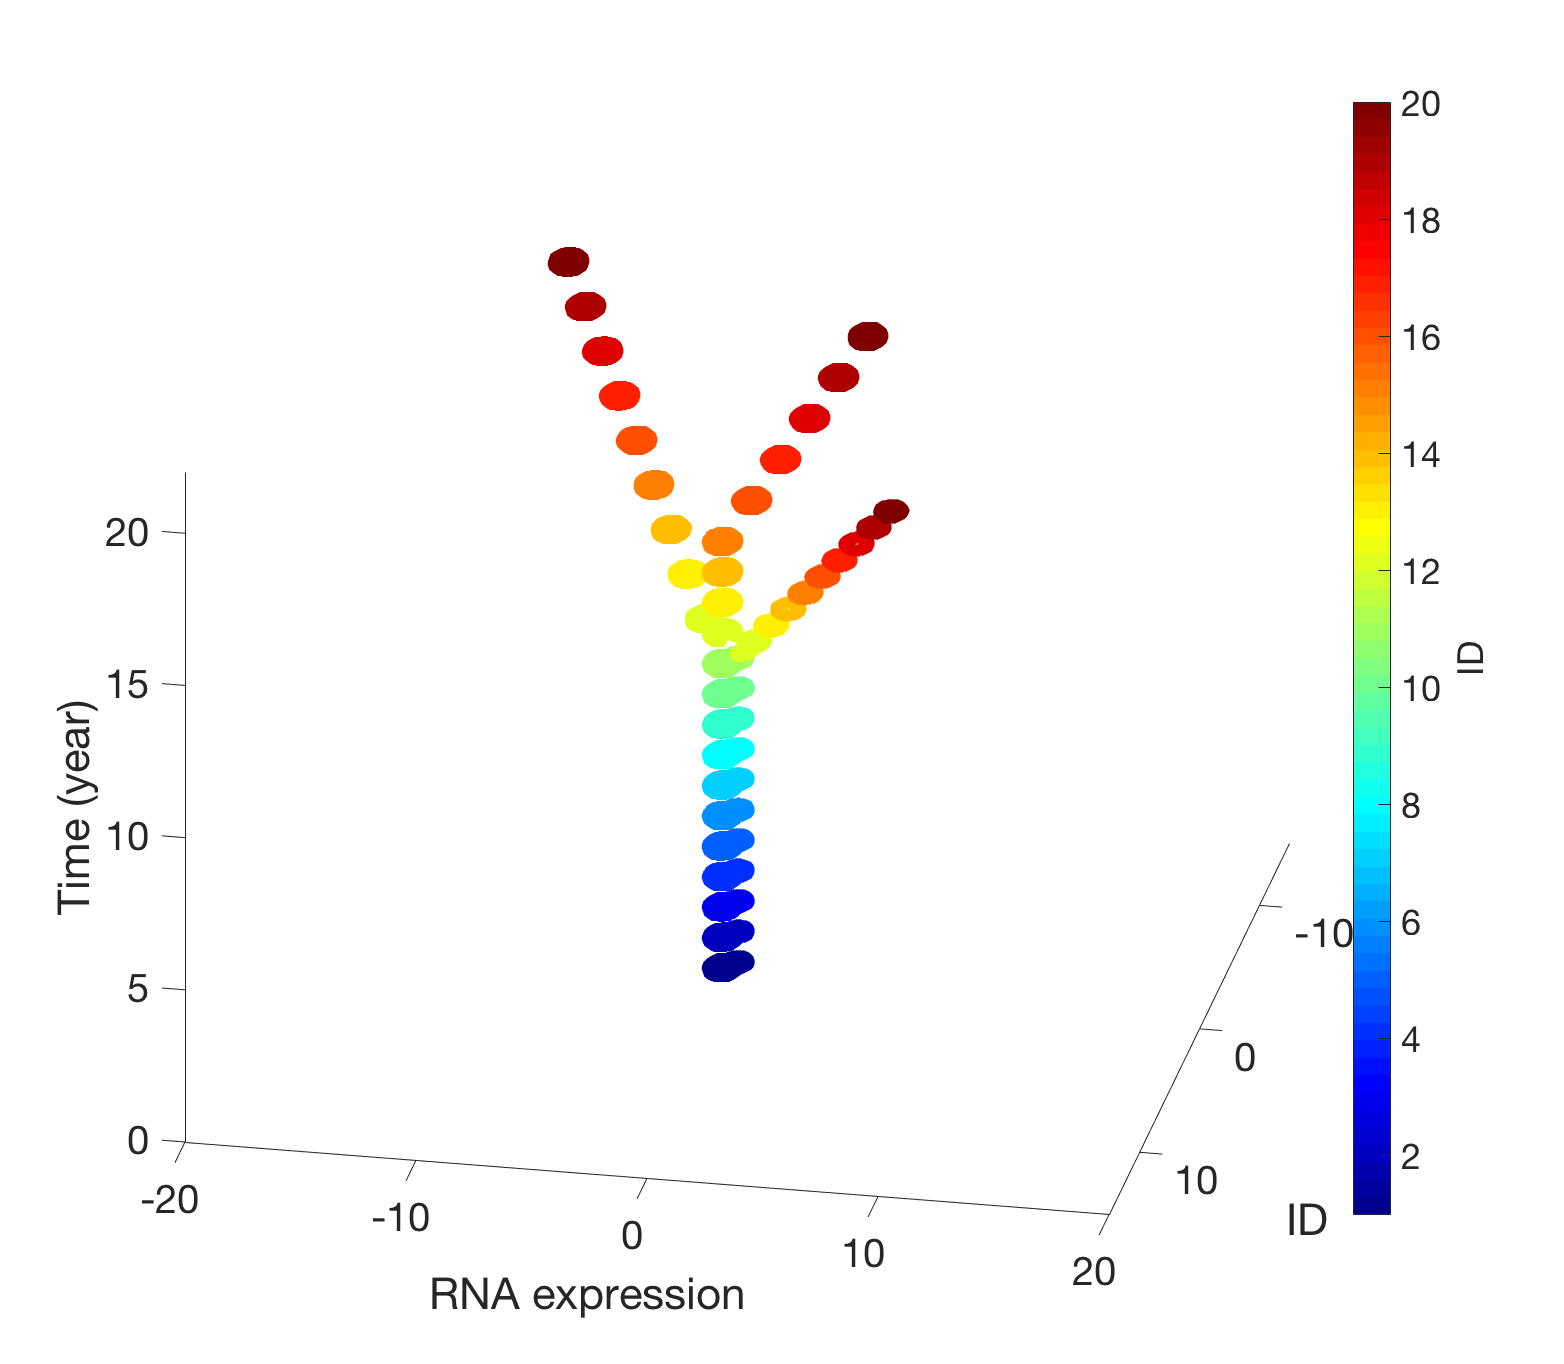
Examples, microarray data (gene vs control/disease group), image data, proteomics data, finance data.
 L O V E
Lecture Slides 3 Lecture 3 code Sorting arrays, find, logic operators, strings and cell arrays and print functions (disp, fprintt,sprintf), circshift(x,1,dim), diff, missing data, rate of change in the data (derivation)

Example: Find patterns in the genes
geneA=’AAAATAGTAGATGATGATGATGTCCATATAT’
geneB=’AAAATATGTAATTGTATGGATGTCCATATAT’
[row,col,v]=find(geneA~=geneB)
Lecture Slides 4 Lecture 4 code Rotation, plotting methods (linear, histogram, bar, pie, 3D, 4D etc.), linear regression (polyfit, fitlm etc.)
strfind(chr1, ‘target’)
save(‘nameoffile’,’variable’) a variable
saveas(gcf, ‘nameoffigure’,’.png’) a figure

Lecture Slides 5 Lecture 5 code Plotting, iteration with for loops, relational and logic operators. (&,| and ~), simulation for random movement


Data encryption

Lecture Slides 6 Lecture 6 code Flow and decision control, for and while loops / if-else if, break. x=find(geneA>90 & geneB>90 & geneC<90), exercises with matlab (bar codes, planets orbit, patterns etc. )


Infinite loop (while) in programming.

Lecture Slides 7 Lecture 7 code Lecture 7-function factorial
Lecture 7-function-gaussion fit
Data normalization, missing values, writing a function and switch/case, menu, input.
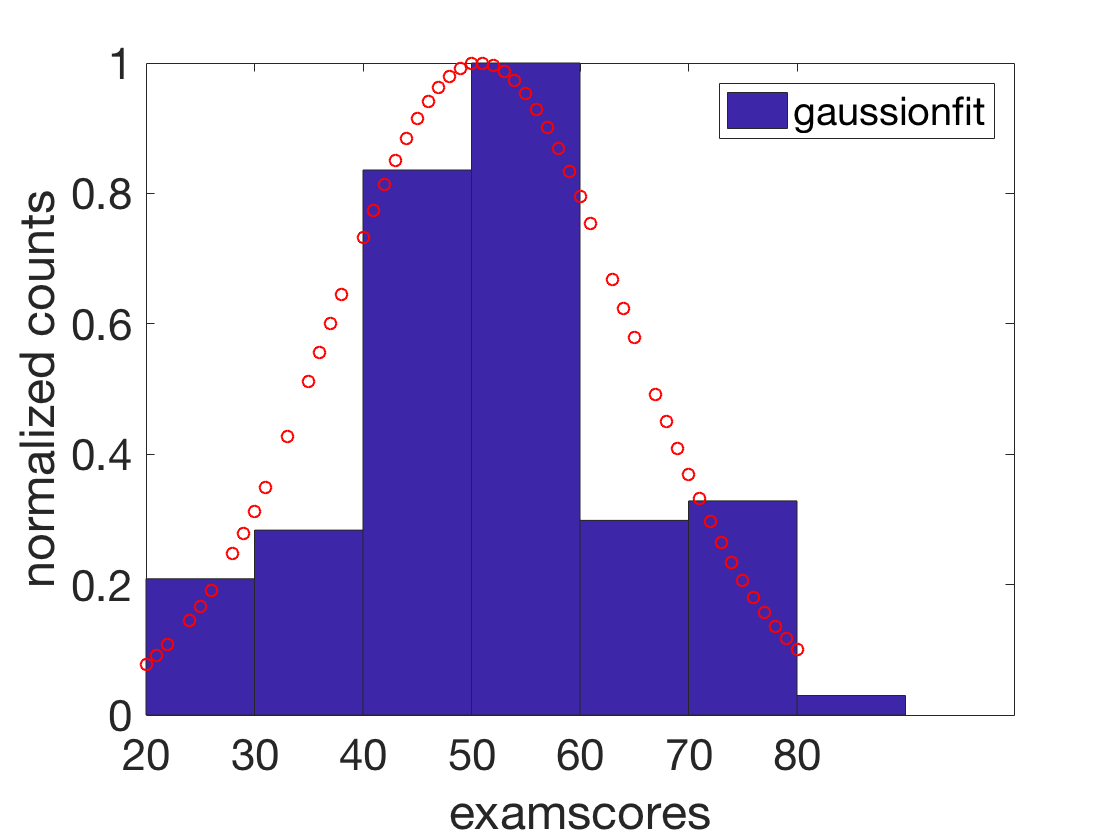
Example, factorial, gaussion function, integration.
Lecture Slides 8 Lecture 8 code (function) Lecture 8-function (bubble sort)
function [output1, output2,…]=name(input1, input2,….,inputn)
- how to declare a function?
- Applications
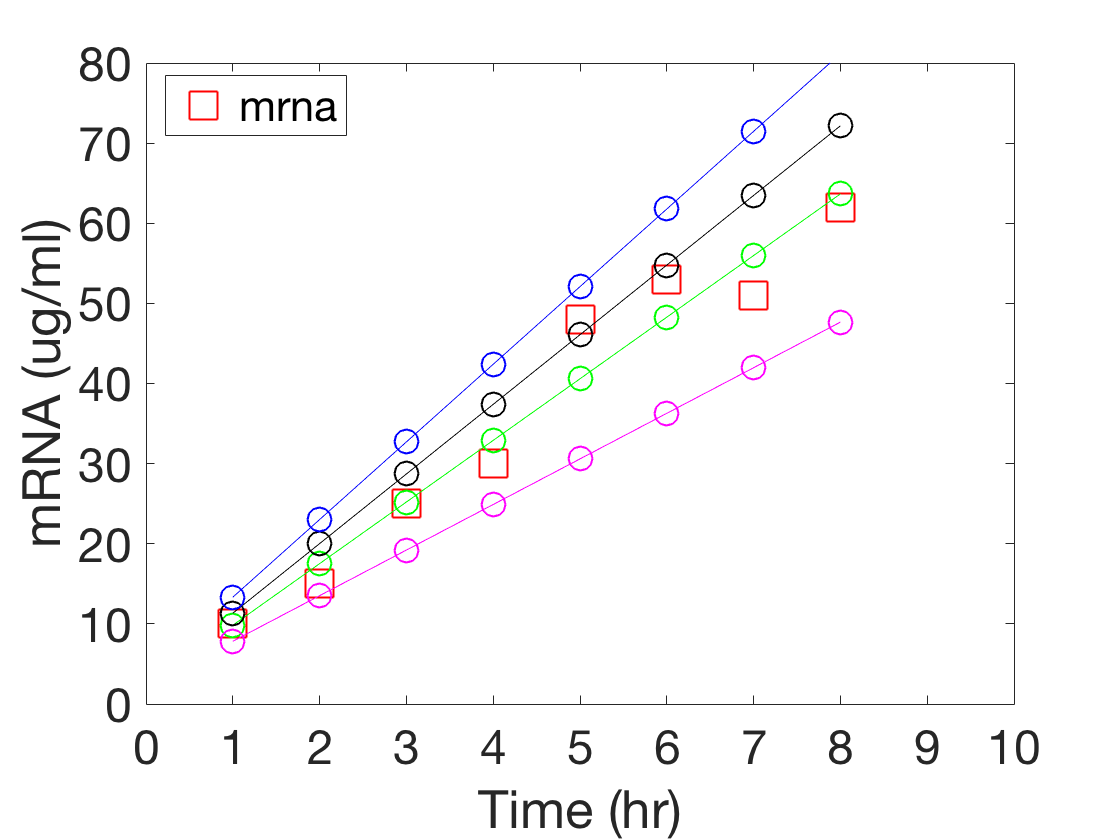
Lecture Slides 9 Lecture 9 code (covariance, correlation, multivariable regression, building a model)
(functions – cov, corrcoeff, fitlm, polyfit)
Applied to answer questions in genetics, medicine, engineering, machine learning and social sciences.
a) multivariate regression (Y = constant + b1 X1 + b2 X2 + b3 X3+….+ bn Xn)
- what variable or variables are the largest effect for change in Y?
- For given X values, predict the outcome Y by using the linear model.

Lecture Slides 10 Lecture 10 code (logistic model-regression/ introduction to machine learning)
a) logistic model, Y outcome – binary variable
example, mRNA levels and cancer prediction, GEO (gene expression repository) data sets.
b) Intro to machine learning models: Example decision trees,

Lecture Slides 11 Lecture 11 code (Intro. to Deep learning)

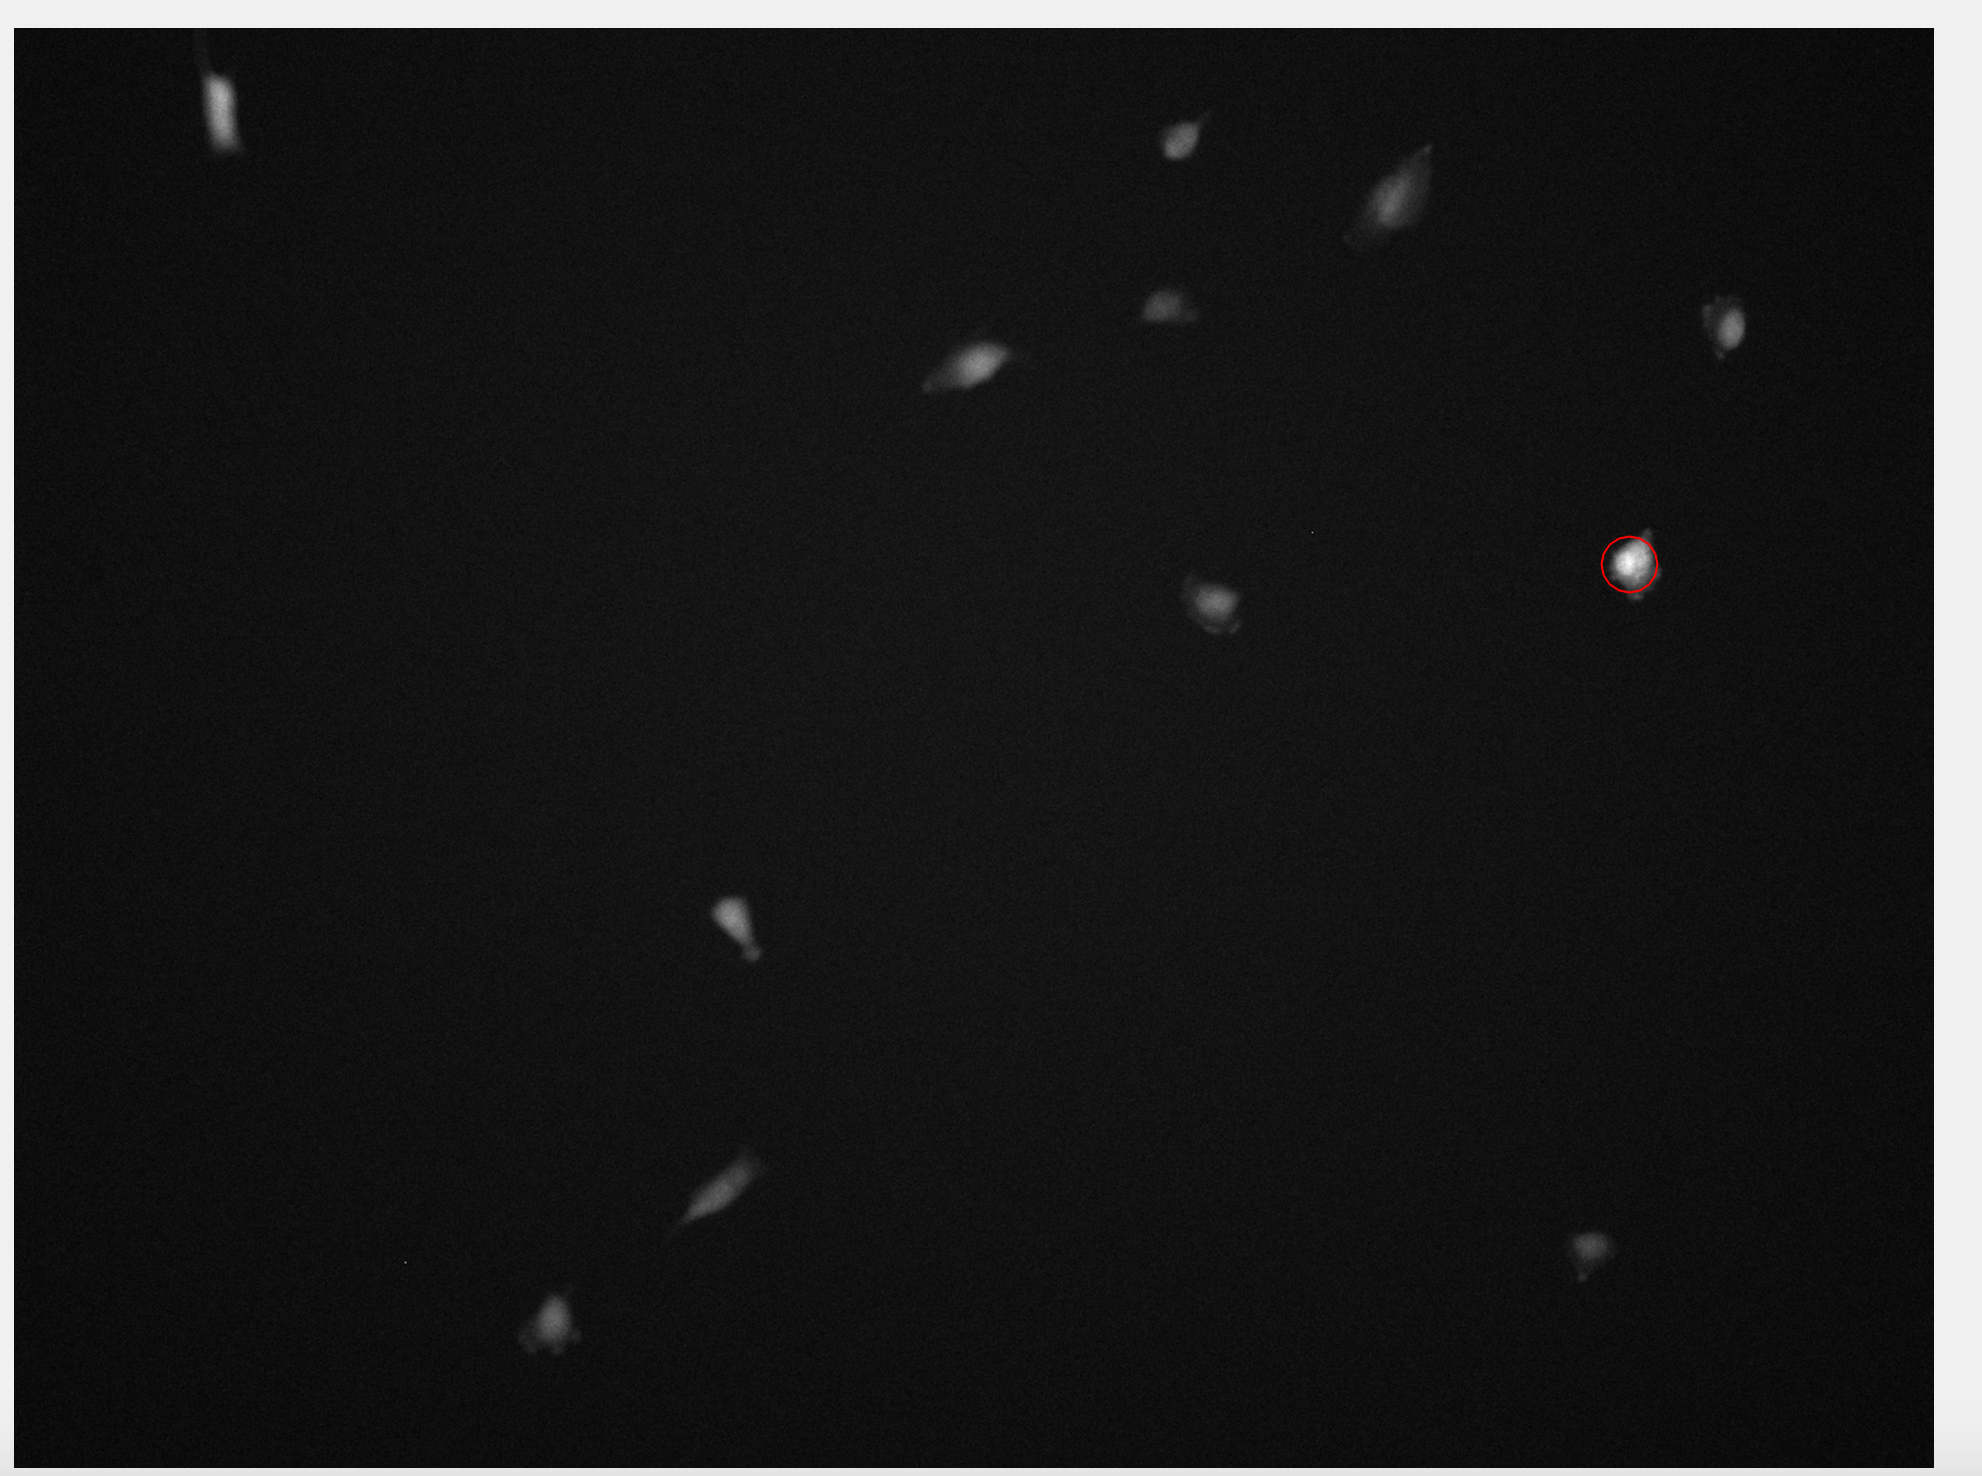
Lecture Slides 12 Lecture 12 code (image processing-1)
a) open file, load, save images, image file info (metadata)
b) find features in images (brightest cell or all cells)
c) histogram, average, max, min intensity from images
Lecture Slides 13 Lecture 13 code (image processing-2)
Example image
a) Intensity profile
b) Image convolution, low pas filtering
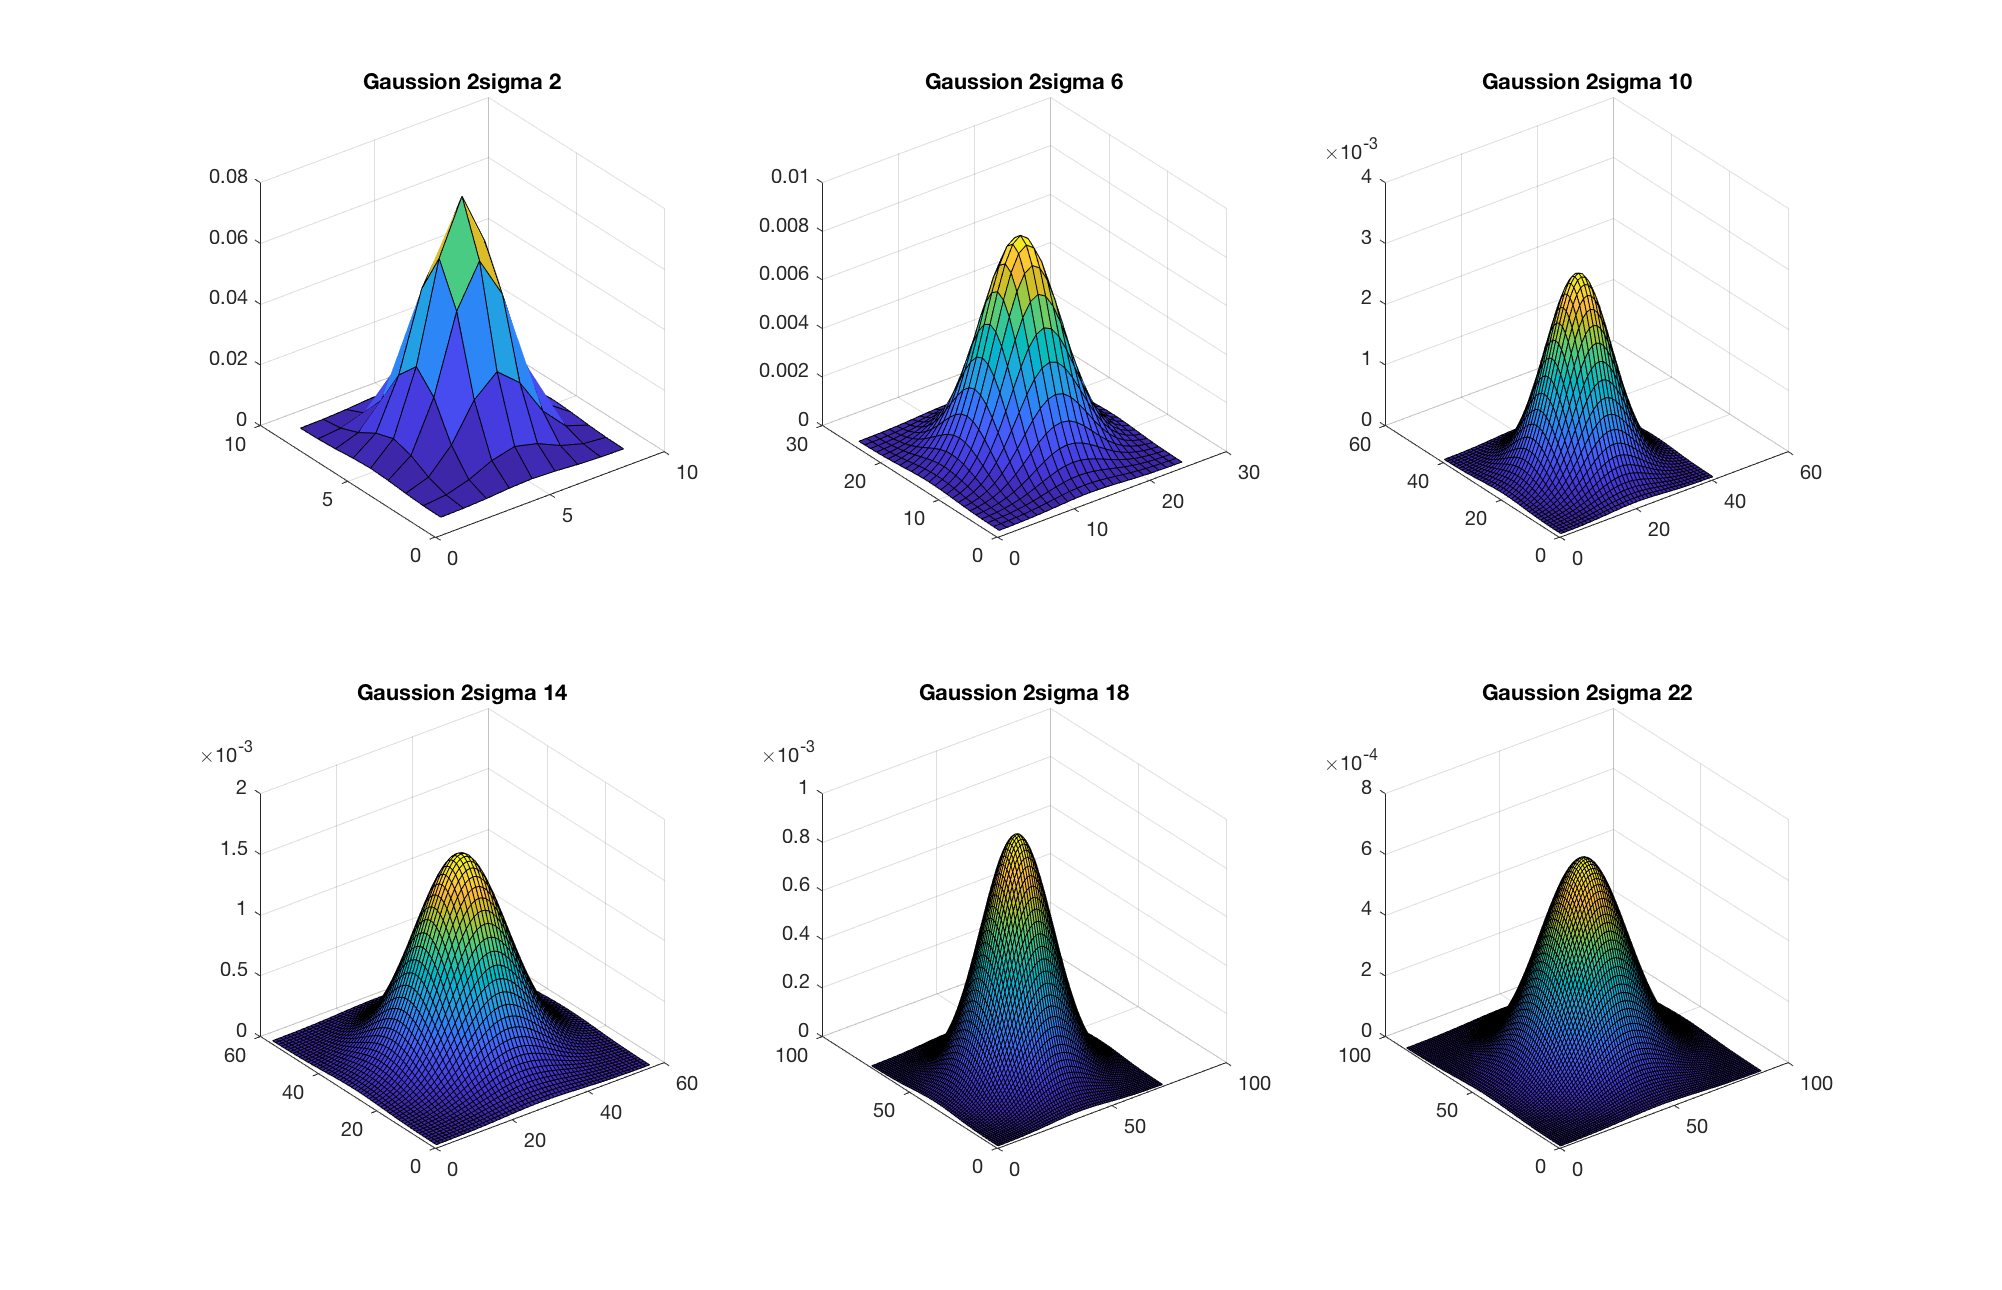
c) 1D and 2D Gaussion function

Lecture Slides 14 Lecture 14 code